Every day, your field sales representatives and B2B e-commerce platforms collect a significant volume of sales data. Yet, in many companies, this information remains underutilized. Sales teams are left navigating without a clear direction, making decisions based on intuition or incomplete information due to a lack of suitable data analytics tools.
The result: missed sales opportunities, inconsistent performance, and teams struggling to focus on sales activities that are not always relevant.
To move away from this uncertain approach, it is essential to rely on accurate, actionable indicators.
KPIs turn the data collected on a daily basis into valuable insights that help you manage sales activities, identify opportunities, and make informed decisions.
1. Understanding KPIs: turn your data into performance indicators
Sales activities naturally generate a wide range of raw numerical data relating to your products, customers, sales, and more. Taken individually and in isolation, this information is not enough to assess your sales performance.
This is where digital tools, such as a mobile SFA (Sales Force Automation) application or a B2B e-commerce platform, come into play.
By centralizing, structuring, and analyzing this data, they turn it into KPIs (Key Performance Indicators).
KPIs are measurable indicators used to assess whether objectives are being achieved and to track changes in your sales performance over time. They provide concrete answers to essential questions:
- Are my sales representatives visiting enough customers?
- Which geographical areas are performing best?
- Which products generate the most revenue?
- Which customers have been reducing their orders over the past few months?
- Which product ranges are growing or declining?
By providing objective answers, KPIs help replace intuition with fact-based decision-making.
2. The essential KPIs for monitoring B2B sales performance
To manage your B2B sales activities effectively, it is recommended to focus on 5 to 7 key KPIs.
This helps maintain a clear overview while avoiding information overload.
Activity KPIs
These indicators measure the volume and quality of sales activities:
- Number of customer visits or sales appointments: provides an overview of field sales activity.
- Customer coverage rate: measures the proportion of customers contacted by your sales representatives over a given period compared with the total customer portfolio. It highlights uncovered areas and customers who receive too little attention.
Performance KPIs
These indicators measure the actual results of sales activities:
- Conversion rate: indicates the proportion of prospects converted into customers and helps assess the effectiveness of the sales process.
- Revenue generated: analyzed by product, customer, or geographical area, this indicator helps identify the main drivers of growth and track their evolution over time.
- Average order value: represents the average amount spent per customer order. Tracking its evolution helps assess the effectiveness of upselling, cross-selling, and product range development initiatives.
- Sales growth: compares performance across different periods (month, quarter, or year) to measure business growth and identify market trends.
- Outstanding customer balances and invoicing: help track amounts yet to be collected and anticipate the risk of late payments or unpaid invoices.
3. How to use your KPIs to manage your sales activities effectively
When monitored and analyzed regularly, KPIs can become powerful drivers of sales performance.
Identify sales opportunities.
Track revenue and customer visit trends to identify best-selling products, rank your most popular items, and determine which products to prioritize. You can also identify high-potential customers and those showing growth. These insights help you direct your sales efforts towards the areas where they will have the greatest impact.
Anticipate declining performance
Conversely, identify underperforming products and product ranges so you can take action quickly. You can also spot neglected customers by comparing performance across different periods. By analyzing ordering patterns, you can quickly detect unusual changes in customer activity, take corrective action, and reverse negative trends.
Measure your sales team’s performance
KPIs are also an excellent tool for sales management. They provide visibility into sales representatives’ activities, make it easier to compare performance across territories or product ranges, and highlight gaps against targets.

Managers gain an objective overview that helps them support their teams, identify training needs, adjust sales activities, and share best practices.
Common mistakes to avoid
- Tracking too many indicators: too much information can be counterproductive. Limit your analysis to a maximum of 5 to 7 KPIs and focus on indicators directly aligned with your B2B sales strategy objectives.
- Tracking KPIs that do not lead to action: if a KPI does not help guide a decision, it is of little value.
- Losing touch with field realities: beyond the theory, figures must always be considered in the context of actual sales activities. They need to be interpreted in light of field conditions and understood within their broader context.
4. Towards smarter sales management
Using KPIs to manage sales performance helps companies move away from intuition-based management towards decision-making based on reliable data.
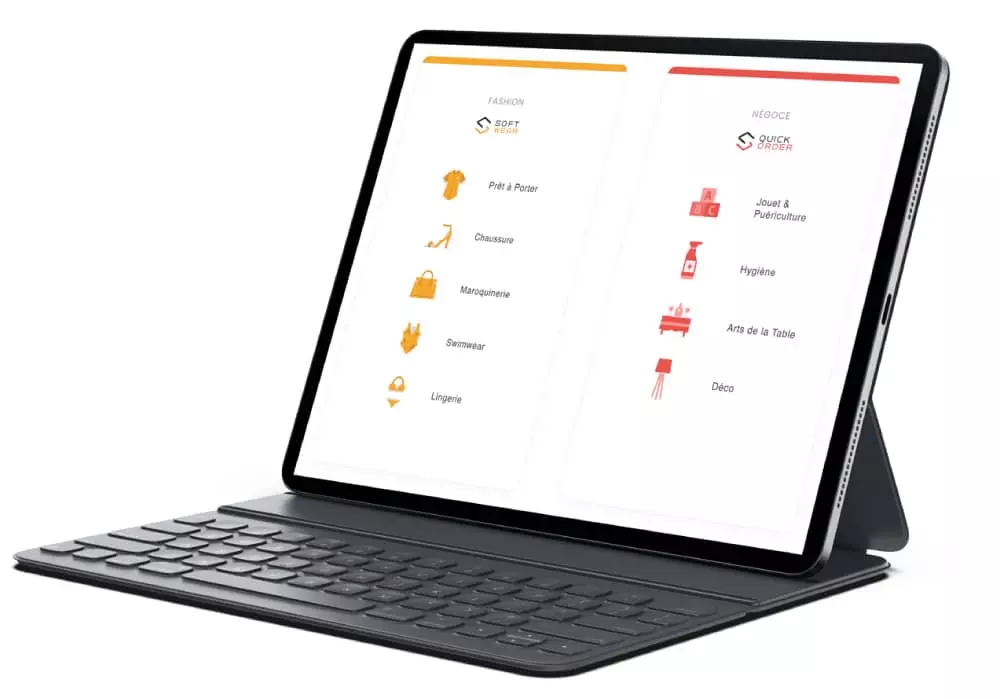
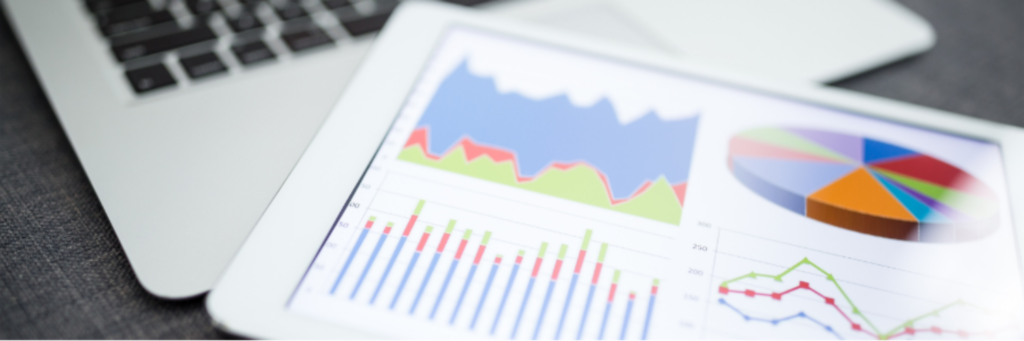
With digital tools such as Quickorder and Softwear, sales managers have access to a comprehensive dashboard at any time, providing a clear and detailed overview of sales performance.
Teams can therefore manage their activities more responsively, prioritize sales actions more effectively, and dedicate more time to selling and building customer relationships.
See also
B2B prospecting: How can digital tools become a valuable help for your field sales team?